


1000/1000
Hot
Most Recent
This paper presents an innovative smart drinking water monitoring system designed to automate the refill process for water dispensers and deliver timely filter replacement alerts, specifically tailored for single-user households. The system utilizes sensors to provide real-time monitoring of water quality, measuring temperature, pH levels, and Total Dissolved Solids (TDS). Users can remotely track these parameters—temperature, pH levels, and TDS—through a mobile application powered by Blynk, a low-code Internet of Things (IoT) platform that connects devices. This real-time system ensures users have convenient access to clean drinking water while eliminating the need for manual monitoring of refills and filter replacements. The proposed Smart Drinking Water Monitoring System revolutionizes traditional water dispensers by automating the refill process and supplying data-driven filter replacement reminders in real-time. By continuously tracking water quality through key metrics like temperature, pH levels, and TDS, the system allows users to remotely monitor developments via a mobile or web app integrated with Blynk's IoT platform. Alerts are generated when pH levels or TDS values deviate from the recommended ranges, suggesting potential filter replacements or maintenance actions are needed.
Access to safe and readily available drinking water is crucial for human health and well-being. Household water filtration systems, such as Brita filters, are commonly used to ensure water quality [1]. However, the manual process of refilling dispensers and replacing filters can be both inconvenient and time-consuming. This is particularly challenging for college students, who are often adapting to a new environment and may be unfamiliar with local water quality while needing consistent access to filtered water.
The Smart Drinking Water Monitoring System aims to resolve these issues by automating the water dispenser refill process and providing real-time, data-driven reminders for filter replacement. The system continuously monitors water quality by measuring temperature, pH levels, and Total Dissolved Solids (TDS). Users can remotely access this data through a mobile or web app integrated with Blynk, an Internet of Things (IoT) platform that connects devices. The system also issues alerts when the pH level or TDS value deviates from recommended ranges, signaling a potential need for filter replacement or maintenance.
By automating the refill process and sending prompt reminders for filter replacements based on water quality insights, the system guarantees users seamless access to clean water without the burden of constant maintenance. Prioritizing health and convenience, this design ensures users have peace of mind regarding the safety of their drinking water.
This paper employs the waterfall software methodology [2], chosen for its suitability in stable requirement environments. The model's step-by-step progression facilitates thorough planning and integration of key features like automated refills and filter reminders, ensuring seamless operation.
Several water quality monitoring systems have been previously documented in the literature. For example, [3] describes a wireless system with a self-healing algorithm that uses sensors to gather water quality data and transmit it to the cloud for storage and visualization, accessible via web interface. Although it offers continuous data collection, the paper lacks details on sensor types and specific water quality parameters.
Similarly, [4] outlines a cost-effective approach for monitoring Reverse Osmosis (RO) filter performance using pressure sensors, which notify users of filter changes through LED indicators and SMS messages. However, this system focuses solely on pressure, overlooking other important factors like pH and contaminant levels. Increased pressure is not the sole indicator of membrane blockage.
In [5], a solar-powered water pump control system incorporates water quality monitoring through sensors measuring pH and turbidity, along with water level, using a single-axis solar tracker for efficiency. Despite highlighting renewable energy advantages, the system lacks real-time water quality monitoring.
Another approach, detailed in [6], uses Raspberry Pi for an IoT-based system that collects real-time water quality data to produce a Water Quality Index (WQI), displayed on a web-based map via Google Maps API. Although informative, the paper lacks implementation specifics.
In [7], an IoT-based real-time monitoring system is presented, employing sensors for pH, CO2, water level, and temperature with wireless cloud transmission for remote access. While cost-effective, focusing on general public use for large water sources limits its application in household drinking water quality monitoring.
The proposed Smart Drinking Water Monitoring System stands out by specifically catering to single-user households and domestic dispensers like Brita. Addressing the inconvenience of manual refills, it enhances user experience with features such as automatic refills and real-time notifications. It empowers users to monitor key quality parameters—pH, temperature, and TDS—providing instant updates on their drinking water's condition, including low or high pH levels and filter replacement reminders.
Table 1 provides a concise overview of each system's features and limitations, helping to distinguish their capabilities and the unique advantages of the proposed Smart Drinking Water Monitoring System in this paper.
Table 1. How the new proposed system compares with others
In the initial phase, a thorough understanding of the needs and objectives for the Smart Drinking Water Monitoring System was established. Single-user households were identified as the target audience, and specific requirements for their water filtration needs were outlined. The proposed system is designed with both functional and non-functional requirements:
The system continuously monitors water levels every second to ensure consistent oversight.
When water levels drop below 15%, the system automatically initiates refilling. Refilling stops once the level reaches approximately 95-100% to prevent overfilling.
Notifications are sent when the Total Dissolved Solids (TDS) value exceeds 80 Nephelometric Turbidity Units (NTU) [8], indicating a need for filter replacement.
Alerts for filter changes are sent to users via the mobile application.
Alerts are issued if the pH level is greater than 8.5 or less than 6.5 [9], indicating extreme pH conditions.
A Raspberry Pi [10] serves as the primary microcontroller due to its availability and user-friendliness, though other microcontrollers may also be suitable alternatives.
A non-contact ultrasonic sensor, like the HC-SR04, is employed for precise water level measurement within the filtration container.
The DS18B20 waterproof temperature sensor is used for accurate water temperature readings.
The system is developed using the Python programming language for its versatility and ease of use.
The Blynk [11] app facilitates monitoring and alert notifications on smartphones.
The Smart Drinking Water Monitoring System is crafted to automate the monitoring and management of water dispensers, ensuring safe and convenient access to clean drinking water. Unlike existing methods, this system uniquely integrates real-time alerts and automatic refilling specifically for single-user households, combining convenience with precise water quality monitoring. The following sections elaborate on the system's architectural design, functional components, and data flow.
The newly designed system architecture employs a modular design, connecting various hardware components with a Raspberry Pi through a Grove Base Hat [12] for streamlined connectivity. This architecture is divided into four primary functional blocks:
Distance Measurement: This module integrates sensors to accurately measure the distance between the Raspberry Pi and target objects or surfaces. It's tailored for applications that require precise spatial measurements, such as monitoring liquid levels in tanks or containers.
TDS (Total Dissolved Solids) Detection: This block features sensors to evaluate the concentration of dissolved substances in a liquid, primarily water, providing crucial data for assessing water quality through the measurement of total dissolved ions.
pH Detection: Utilizing specialized sensors, this module measures the pH level of a liquid to determine its acidity or alkalinity, which is vital for applications in environmental monitoring, agriculture, and aquaponics.
Temperature Detection: This essential module measures temperature, delivering important context for understanding environmental conditions and chemical processes.
These functional blocks are designed to seamlessly interface with the Raspberry Pi via the Grove Base Hat [12], facilitating straightforward communication and data exchange. The supporting software processes the sensor data, displays results, and enables user interaction, potentially including alert notifications or control features (Figure 1).

Figure 1. Structure Chart of the system architecture
Here are the hardware specifications for the system:
The Blynk App is integrated to provide users with remote monitoring capabilities for water quality and dispenser status. The app offers real-time data on water levels, temperature, pH, and TDS values, and sends alerts for filter replacement or maintenance, ensuring proactive water management through its intuitive interface.
The system's data flow is structured to begin with sensor readings and culminates in user notifications and control actions. Here’s an updated overview of the process:
By adopting new sensor technologies and methods, the system enhances reliability and accuracy in managing water levels and ensuring water quality, while the Blynk App continues to provide critical user engagement and control (Figure 2).
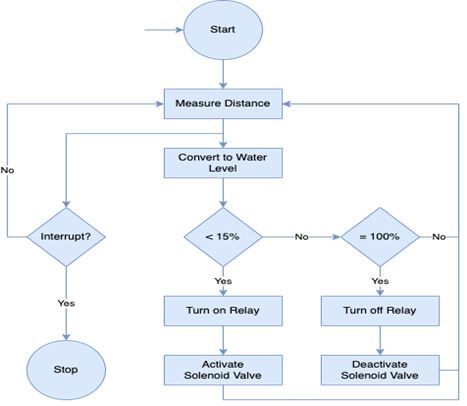
Figure 2. Flowchart for Water Control
Figure 3 illustrates the process of detecting Total Dissolved Solids (TDS) in the water. In this system, if the TDS value exceeds 80 ppm (parts per million), which indicates a high level of impurities, a notification is sent to the user prompting them to change the filter. If the TDS value reaches a further threshold of 200 ppm, it triggers a warning about high turbidity, alerting the user to potential water quality issues that require prompt attention.
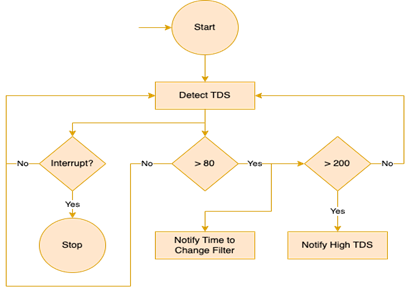
Figure 3. Flowchart for TDS Detection
Figure 4 outlines the steps for analyzing the pH level of the water. If the pH value falls below 6.5, indicating acidity, the system issues a warning about low pH. Conversely, if the pH exceeds 8.5, indicating alkalinity, the system generates a warning about high pH. These alerts inform the user of potential water quality concerns that may require intervention.

Figure 4. Flowchart for pH Detection
Figure 5 displays the Data Flow Diagram (DFD) of the system, depicting the interaction between the various sensors and system components. The diagram illustrates how the TDS and pH sensors continuously monitor water quality parameters, while the temperature sensor tracks the water temperature. Additionally, the distance sensor gauges the water levels. This visual representation clearly outlines the pathways for data collection and processing within the system, emphasizing the seamless integration of sensor data for holistic monitoring and effective management.
The following algorithm explains and outlines the sequential steps the system (presented in figure 5) follows to collect and process data from various sensors, ensuring comprehensive monitoring and management.
Algorithm: Data Flow in Smart Drinking Water Monitoring System

Figure 5. Data Flow Diagram
Implementation Overview
The implementation of the Smart Drinking Water Monitoring System consists of several key phases, including hardware setup, software development, and sensor integration. Below is a detailed breakdown:
Hardware Setup
Challenges and Solutions
Circuit Diagram
In summary, this structured approach to hardware setup, combined with strategic solutions to compatibility issues, establishes a robust foundation for the implementation of the Smart Drinking Water Monitoring System (Figure 6).

Figure 6. Circuit Diagram for the hardware architecture of the proposed Smart Drinking Water Monitoring System
Detailed Hardware Setup and Connections
The following explicit labeling of the pin connections and power details ensures accuracy in the hardware setup, facilitating effective replication and troubleshooting of the system.
Central Computing Unit
Raspberry Pi 4 Model B:
Power Supply: Uses a 5V/3A power adapter connected to the USB-C power port.
GPIO Pins: Connects to sensors and actuators through the GPIO (General-Purpose Input/Output) pins using the Grove Base Hat.
Sensors and Actuators Connections
Ultrasonic Sensor (HC-SR04):
VCC (Power): Connects to the 5V pin on the Raspberry Pi.
Trig (Trigger): Connects to GPIO Pin 23.
Echo: Connects to GPIO Pin 24.
GND (Ground): Connects to a Ground pin on the Raspberry Pi.
Waterproof Temperature Sensor (DS18B20):
VCC (Power): Connects to the 3.3V pin on the Raspberry Pi.
Data: Connects to GPIO Pin 4 (requires a 4.7k ohm resistor between VCC and Data lines).
GND (Ground): Connects to a Ground pin on the Raspberry Pi.
pH Sensor:
VCC (Power): Initially not connected during boot-up; connected to the 5V pin after startup.
Signal: Connects to an available GPIO pin as an analog signal interface.
GND (Ground): Connects to a Ground pin on the Raspberry Pi.
TDS Sensor:
VCC (Power): Connects to the 5V pin on the Raspberry Pi.
Signal: Connects to a GPIO pin used for reading analog signal inputs.
GND (Ground): Connects to a Ground pin on the Raspberry Pi.
Solenoid Valve and Relay Module:
Relay Control Pin: Connects to an available GPIO pin (e.g., GPIO Pin 17) for controlling the valve.
VCC and GND (Power): Connects to the 5V and GND pins on the Raspberry Pi for powering the relay module.
Additional Details
· Breadboard and Jumper Wires:
Used to create connections between the sensors, relay module, and Raspberry Pi, ensuring flexible and secure hookups.
· Grove Base Hat for Raspberry Pi:
Simplifies attachment to the Raspberry Pi and organizes connections, particularly useful for beginners in electronics.
The software development process for the Smart Drinking Water Monitoring System focused on Python programming, chosen for its simplicity and compatibility with Raspberry Pi. The implementation leveraged several key libraries:
System Logic
The core logic of the system revolves around automating water dispenser management while ensuring the provision of safe and clean drinking water. Key functionalities include:
User Experience
The system design prioritizes user convenience and safety by:
These features ensure users have peace of mind regarding their drinking water quality, enhancing the overall experience for both single-user households and communities.
Sensor Calibration
Here is a more detailed explanation of the pH sensor calibration strategy, including the methodology, buffer solutions used, and frequency of recalibration:
Objective:
The calibration of the pH sensor is crucial to ensure accurate and reliable readings of water quality. Calibration involves adjusting the sensor to recognize standard pH values accurately, which helps in maintaining precise monitoring of the water's acidity or alkalinity.
Methodology:
Employing a systematic calibration process with standardized buffer solutions ensures the accuracy and reliability of the pH sensor readings. Regular recalibration helps maintain consistent monitoring of water quality, enabling timely interventions if the water's pH levels deviate from acceptable ranges.
Code Examples: Figures 7, 8, 9, 10, and 11 showcase code snippets that encapsulate the system's major functionalities, offering insights into the implementation details.
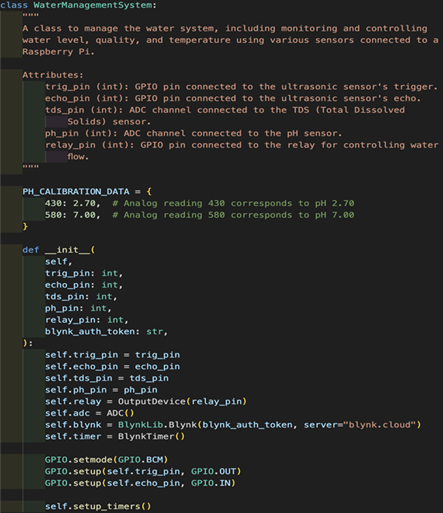
Figure 7. Initialization of Water Management System Class
Figure 7 shows the code for the initialization of water management system class. The purpose of this figure is to show the code for the setup and initialization of the primary class responsible for managing the system's operations.
The components in this code are as follows:
Constructor Method: Initializes key variables and sets up sensor objects, GPIO pins, and initial system states.
Configuration: Includes setting up default values for the sensors, actuators, and any initial conditions required for the system to begin operating correctly.
Comments: Ensure the constructor comments on required libraries, initialization steps for Raspberry Pi GPIO, and setup for communication interfaces if necessary (e.g., I2C, SPI).
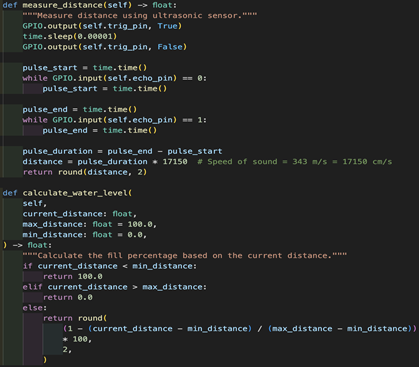
Figure 8. Distance and water level functions
Figure 8 shows the code for the distance and water level functions. The purpose of this figure is to show the functions managing ultrasonic sensor inputs to determine the water levels.
The components in this code are as follows:
Distance Measurement: Code to send a pulse from the ultrasonic sensor and listen for the echo, calculating the distance based on time taken.
Water Level Calculation: Converts the measured distance into a percentage of the tank's fullness.
Comments: Describe the logic for the time-to-distance conversion and ensure handling of edge cases like sensor malfunction or unexpected readings.
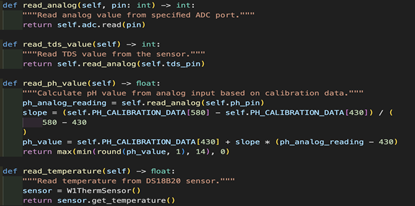
Figure 9. Functions to read data from sensors
Figure 9 shows the code for the functions to read data from sensors. The purpose of this figure is to show the functions facilitating the reading and processing of data from pH, TDS, and temperature sensors.
The components in this code are as follows:
Analog and Digital Reads: Functions leveraging the Raspberry Pi’s ADC for obtaining readings from the sensors.
Data Validation: Logic to filter and validate sensor data, ensuring accuracy.
Comments: Clarify calibration techniques applied in the code and note any conversion formulas used to translate raw data into meaningful measurements.

Figure 10. Control functions, Blynk app connections and timer setup.
Figure 10 shows the control Functions, Blynk App connections, and timer setup. The purpose is to manage the actuator control, integrate with Blynk app for user interface, and configure timing operations for periodic tasks.
The components in this code are as follows:
Relay Control: Functions to activate solenoids or pumps based on water levels or quality thresholds.
App Connectivity: Blynk API calls to update the user interface and push notifications.
Timers: Setup for functions that need to run at defined intervals (e.g., periodic sensor readings).
Comments: Explain the control logic and clarify authentication methods with Blynk to ensure connection security.
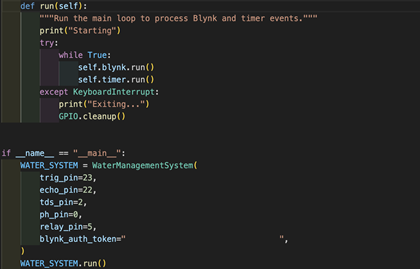
Figure 11. Main loop.
Figure 11 shows the main loop. The purpose of the code is to illustrates the primary execution loop where system functions are orchestrated.
The components in this code are as follows:
Continuous Monitoring: Loop conditions to repeatedly check sensor data and maintain system operation.
Event Handling: Responses to changes in data, triggering alerts or refilling processes when needed.
Comments: Highlight critical decision-making processes and safeguard mechanisms to handle exceptions or operational errors.
By structuring the code this way, the Smart Drinking Water Monitoring System can effectively integrate its hardware and software components, offering coherent functionality and a seamless user experience. Furthermore, the decision-making logic ensures water quality and availability, enhancing the system's reliability.
Function Overview: Table 2 lists all the functions employed in implementing the system, serving as a comprehensive resource for understanding how the system operates.
By incorporating these sophisticated functionalities and a user-centric design, the Smart Drinking Water Monitoring System offers a reliable and effective solution for ensuring access to clean and safe drinking water.
Table 2. Function table for the implantation of the proposed system
|
No |
Function |
Input |
Output |
Description |
|
1 |
measure_distance |
Ultrasonic Sensor Pins |
Distance |
Provide the distance of the closest surface from the ultrasonic sensor |
|
2 |
calculate_water_level |
Current Distance |
Percentage of |
Convert the distance parameter to water level percentage based on the custom min and max height of the filter as specified |
|
3 |
read_analog |
Analog Port |
Analog Reading |
Provide the analog reading from the sensor connected to the given port |
|
4 |
read_tds_value |
TDS Pin |
TDS Value |
TDS reading from the sensor |
|
5 |
read_ph_value |
pH Pin |
pH Value |
Calibrated pH reading |
|
6 |
read_temperature |
n/a |
Temperature value |
Temperature reading in Celsius |
|
7 |
check_water_level |
n/a |
n/a |
Control relay based on the water level and send water level data to the Blynk app |
|
8 |
check_water_quality |
n/a |
n/a |
Send pH and TDS readings to the Blynk app and control notifications |
|
9 |
setup_timers |
n/a |
n/a |
Setup time intervals at which to run our functionalities |
|
10 |
run |
n/a |
n/a |
The main looping function |
The hardware components were assembled according to the system design, and software modules underwent thorough testing to ensure precise sensor readings and reliable actuator control.
The results demonstrate the effectiveness of the proposed Smart Drinking Water Monitoring System prototype:
Overall, the proposed system stands out for its automation, real-time monitoring capabilities, and user-friendly design, making it a robust solution for managing drinking water quality and availability.
Each caption focuses on how the system leverages real-time readings and alert notifications to provide a comprehensive, user-friendly monitoring and management solution. Here are enhanced captions for each figure, emphasizing key components, real-time readings, and alert notifications:
Figure 12 presents the web app interface of the Smart Drinking Water Monitoring System. It showcases the system's real-time monitoring capabilities, allowing users to access an intuitive dashboard that displays live water quality parameters, such as pH, temperature, and TDS levels. The interface enhances user interaction by providing immediate feedback and comprehensive data visualization to aid in informed decision-making regarding water quality.
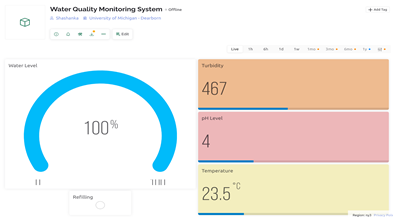
Figure 12. Web app interface
Figure 13 illustrates the mobile app interface designed for user convenience and accessibility. The mobile platform offers real-time updates on water quality metrics, including live alerts for any changes in water levels or quality that demand attention. The streamlined design ensures that users can effortlessly monitor system status, receive notifications, and manage system operations from anywhere, adding a layer of flexibility and control to the user experience.

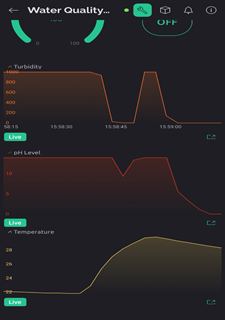
Figure 13. Mobile App interface
Figure 14 depicted here is the system's alert mechanism for pH monitoring, demonstrating its capability to issue real-time alerts for abnormal pH levels. Notifications are sent directly to the user when pH readings fall outside safe ranges, ensuring timely awareness and allowing users to take immediate corrective action. This feature underscores the system's commitment to maintaining optimal water quality and user health.


Figure 14. pH notifications
Figure 15 highlights the alert system for turbidity and filter maintenance. It provides a detailed view of how the system broadcasts notifications for elevated turbidity levels and necessary filter changes. These alerts are essential for proactive maintenance, informing users promptly to uphold both water clarity and filtration efficiency. The notifications system enhances user engagement and accountability, ensuring a high standard of water quality management.


Figure 15. Turbidity and filter change notifications
Table 3. Table of comparison between existing and our proposed system
|
Features |
Wireless water quality cloud monitoring system with a self-healing algorithm |
IoT Enabled RO Water Filter Indicator |
Solar-Based Smart Water Pump Control with Turbidity and pH Measuring System |
Water Quality Index Using IoT |
Real-Time Water Quality Tracking and Alert System with IoT Integration |
Our Proposed Smart Drinking Water Monitoring System |
|
Goal |
Remote monitoring, system health |
Monitoring RO filter performance |
Precision agriculture, water quality control |
Provide overall water quality index |
Real-time monitoring of water from general sources |
Real-time monitoring of drinking water and data-driven filter replacement reminders |
|
Technology |
Arduino UNO; Atlas Scientific Full Water Monitoring Kit |
Reverse Osmosis, Pressure gauge |
Solar panel, Arduino, sensors |
Raspberry Pi, Water quality sensors |
Raspberry Pi, IoT |
Raspberry Pi, Blynk, IoT |
|
Monitored parameters |
Oxidization-Reduction Potential, pH, Electrical Conductivity, and temperature |
RO membrane health, pressure on the membrane |
Turbidity, ph. |
Water Quality Index |
Ph., CO2, Water level, temperature |
Water level, Temperature, Ph., Total Dissolved Solid |
|
Target application / Users |
To use a self-healing algorithm to recover in case of server disruption during real-time data collection |
Residential use using RO filters |
Household |
To control water pollution |
Alert people in local areas about water quality in their areas |
Single household / international students using small water dispensers (Brita filter) |
|
Water source focus |
water stream in University Technology Malaysia |
Reverse Osmosis (RO) filtration system |
Surface water |
General water source |
Water lake, water bore-well |
Drinking water |
|
Alert mechanism |
No alert; Graphs and tables shown on the website |
LED indicator and beep sound and SMS |
LCD and message notification using Arduino GSM |
No alert |
Yes, available on the cloud as a message |
Notification on mobile app |
|
Refill mechanism |
No |
No |
Yes |
No |
No |
Yes |
|
Advantage |
The system recovers itself in case of wireless service connection failure |
Filter maintenance alerts |
Operated by solar power to operate the water pump |
The Water Quality Index of different regions can be seen with Google Maps API |
Minimize collecting water samples and sending them back to the lab for testing |
Automatic refilling, real-time alert, user-friendly readings |
|
Limitation |
Needs wireless connection |
Limited to Ro systems |
Light-dependent resistors are easily affected by dust |
Requires expertise, WQI may not be user-friendly |
The testing environment is not specified
|
Proof of concept with simulation |
The development of the Smart Drinking Water Monitoring System marks a significant step toward automating and enhancing water quality management. However, there are exciting possibilities for future research and development that could further refine and expand its capabilities. One promising direction is the integration of AI-based predictive maintenance. By analyzing patterns in sensor data, AI algorithms could predict when components like filters and sensors are likely to fail or require maintenance, thereby preventing issues before they arise and improving system reliability and longevity. Another potential avenue is the incorporation of cloud-based analytics, which would enable more sophisticated data handling and analysis. By storing data in the cloud, the system could leverage advanced analytics tools to provide users with deeper insights into water quality trends and anomalies over time. This approach could support real-time decision-making as well as long-term strategic planning by offering predictive insights into potential water quality issues. Exploring these future research directions could significantly enhance the functionality and value of the Smart Drinking Water Monitoring System, making it an even more robust resource for users in monitoring and maintaining the quality of their drinking water. These advancements would not only improve the technical aspects of the system but also contribute to increased user empowerment and satisfaction through better-informed water management.
This paper presents a real-time system that effectively integrates various sensors to monitor water quality, including temperature, pH levels, and TDS. Users can easily access this data and receive alerts on their mobile devices through the Blynk Internet of Things app. By eliminating the need for manual refilling and filter replacement monitoring, the system promotes convenient access to clean drinking water and has the potential to improve user health outcomes.
While this paper establishes a functional prototype, there is room for further development and exploration:
As the system evolves, several challenges may need to be addressed:
By addressing these challenges and exploring future enhancements, the Smart Drinking Water Monitoring System can develop into a comprehensive, user-centric solution. It offers the potential to significantly impact the availability and quality of drinking water in single-user households and beyond.
